News
4 Nov 2013: Reproducible paper with Lancet and IPython Notebook
An IPython Notebook reproducing the results of Stevens et al. (J. Neuroscience 2013) is now available as an example in the Tutorials section. This notebook is designed to show how to write a reproducible paper using Topographica, IPython Notebook, and Lancet.
2 Oct 2013: New paper using Topographica
Stevens et al. (J. Neuroscience 2013) shows results from the GCAL model included with Topographica (examples/gcal.ty). The GCAL tutorial shows how to explore a running GCAL model, and the GCAL demo shows how the model develops over time.
2 May 2013: New web site
Topographica has moved to a Sphinx and reStructuredText website with online editing in Git, and integrated User and Reference Manuals, thanks to contributions from Wiktor Brodlo. Please let us know if there are any problems, and meanwhile if you add code to Topographica, please also contribute documentation in .rst format, which is very easy to write and maintain.
23 Nov 2012: Version 0.9.8 released
- General improvements:
- now uses native Python by default, making it much easier to integrate Topographica into your scientific workflow
- shared-memory multiple-core support (via OpenMP)
- support for Python 2.7, NumPy 1.6, IPython 0.11-0.12, and Matplotlib 1.1.0
- Mac OS X: right click supported on more platforms, automatic .ty file syntax colouring in Xcode 3
- snapshots created by version 0.9.7 and above will be supported
- default output path now in a Topographica subfolder of your system’s Documents directory (often ~ on Linux; typically Documents elsewhere)
- simpler installation using pip on all platforms
- no longer need to build topographica script on installation
- minor bugfixes
- Command-line and batch:
- –pdb calls debugger after every unhandled exception
- Example scripts:
- ptztracker.ty: example of controlling a pan/tilt/zoom camera to track objects in real time
- new “models” subdirectory for published work; “examples” is now meant only for simpler starting points
- GUI:
- Model Editor allows text labels to be suppressed so that .eps output can be labeled in an illustration program (e.g. Inkscape) for use in publications
- New plot options for right-clicking: plot in sheet coords, plot in matrix coords, autocorrelation (requires SciPy)
- Component library:
- PatternGenerators: Sigmoid (half plane with sigmoidal border), LogGaussian (Gaussian with skew), SigmoidedDoG (auditory RF with a DoG multiplied by a sigmoid), SigmoidedDoLG (auditory RF with two DoLGs multiplied by a sigmoid), new CameraImage (OpenCV live camera import) pattern families
- DistributionStatisticFn classes for controlling map and tuning curve measurement: DSF_MaxValue (preference is peak value) DSF_WeightedAverage (pref is weighted average) DSF_VonMisesFit, (from von Mises circular normal fit), DSF_BimodalVonMisesFit (bimodal distribution fit; also see DSF_TopTwoValues and DSF_BimodalPeaks).
- Array parameter
- Simulation and EventProcessors now support tab completion and ”.” access to their Sheets and EPConnections (e.g. “topo.sim.V1.Afferent”)
- greatly expanded support for auditory input; see imagen.audio
3 Oct 2012: Topographica development moved from SourceForge SVN to GitHub git.
SVN write access has now been disabled. See the Git Crash Course to translate your SVN commands to Git. All features since 0.9.7 are now available from github, and all sf.net bugs and feature requests have been converted to GitHub issues. The Param and ImaGen subprojects now accompany Topographica as git submodules, allowing easy editing while leaving them as separate projects. Installation is now via either git (for developers) or pip (for users).
18 Jul 2012: New subprojects at GitHub
New subprojects at GitHub have been created for elements of Topographica that are widely reusable in other projects:
- Param and ParamTk
- General-purpose support for full-featured Parameters, extending Python attributes to have documentation, bounds, types, etc., with optional Tk support.
- ImaGen
- General-purpose support for generating 0D (scalar), 1D (vector), and 2D (image) patterns, starting from mathematical functions, geometric shapes, random distributions, images, etc.
These subprojects contain code still used in Topographica (with imagen visible as topo.pattern for backwards compatibility), but can now be downloaded and installed separately. Both projects were introduced at SciPy 2012 (Austin, TX); the talk on Param is available online.
18 July 2010: Version 0.9.7 released
- General improvements:
- now released under less-restrictive BSD license instead of GPL, to facilitate commercial use of components
- now supports Python 2.6
- significantly reduced memory consumption (35% less for lissom.ty)
- minor bugfixes
- now available as .deb package for Ubuntu and .rpm for Fedora Core, in addition to .zip and .tar.gz versions, and via ‘easy_install topographica’
- optional PyFlakes package for detecting common Python problems
- optional mpi4py package using MPI for writing parallel applications
- instructions available for checking out Git version of repository
- Command-line and batch:
- run_batch accept new name_time_format and dirname_prefix parameters
- n_bytes, n_conns, print_sizes: display size and memory usage of current network
- GUI:
- moved progress bars, messages, warnings, and errors into the status bar for each window, to make it clear where the error or status issue arose
- Plotting:
- more joint normalization options (JointProjections, AllTogether, Individually), to show relative differences in weight strength and activity
- PhaseDisparity plot
- Component library:
- PatternGenerators: ExponentialDecay, HalfPlane, Arc, Curve, Rectangle (now with smoothing), RawRectangle (no smoothing), Sigmoid, SigmoidedDoG (for audio STRFs), PowerSpectrum (for frequency decomposition), Spectrogram (for frequency decomposition over time), Audio (for audio files), AudioFolder (for directories of audio files)
- SpiralGrating, HyperbolicGrating, RadialGrating, ConcentricRings, and ArcCentered pattern families can be copied from contrib/hegdeessen.py; to move to topo.pattern in next release
- minor changes to PatternGenerator parameter passing to allow better nesting and composition
- misc: linearly_interpolate, clip_upper
- Example scripts:
- gcal.ty: robust and simple visual map development
- lissom_audio.py: example of auditory pathway
12 February 2009: Version 0.9.6 released
- General improvements:
- significant performance improvements in simulations (nearly 2X overall), plotting (2X), and startup time
- minor bugfixes
- more options for adding noise to ConnectionField shapes
- optional line-by-line profiling
- optional Cython package for writing fast components
- Command-line and batch:
- -v and -d options to print verbose and debugging messages
- new options to run_batch and better progress messages
- replaced most commands with ParameterizedFunctions, which have documented, type and bound-checked arguments and allow inheritance of shared functionality
- replaced map measurement commands in topo.command with simpler, general-purpose, easily .ty-file controllable versions (see lissom_oo_or.ty and lissom.ty for examples)
- save_plotgroup: more useful default values; results can be cached to avoid recomputation
- measure_sine_pref: general purpose measurement for any preference that can be tested with a sine grating
- Changed locals to script-level parameters using GlobalParams; see examples/lissom.ty
- Made gradientplot and fftplot available in batch mode.
- GUI:
- model editor supports non-Sheet EventProcessors and non-CFProjection EPConnections
- right-click option for plotting tuning curves
- plot windows can be arranged in 2D, not just a row (see Sheet.row_precedence)
- Example scripts:
- example file for interfacing to external simulators (examples/perrinet_retina.ty)
- removed outdated or in-progress examples
- greatly simplified remaining example scripts
- now use GlobalParams to support consistent option setting using -p
- allowed saving of local functions and instance method calls in snapshots
- Component library:
- PatternGenerators: Translator; mask_shape parameter also now makes it easy to specify a mask for any pattern, e.g. in the GUI
- TransferFns (formerly called OutputFns): HalfRectifyAndPower, Hysteresis, and HomeostaticResponse
- Sheets: ActivityCopy
- LearningFns: CFPLF_BCMFixed_opt, CFPLF_Scaled_opt
- Added HookList parameters to FeatureResponses and LISSOM to make it easier to add user-defined functionality.
- Changed names and definitions of various similar concepts (OutputFn, before_presentation, update_command, plot_command, etc.) to reflect shared concept of Hooks and HookLists (lists of callables to run at specific spots in the code).
- Parameters: bounds can now be exclusive, optional support for None in most types
We also provide a utility to simplify the process of updating scripts that were written for version 0.9.5.
05 September 2008: Version 0.9.5 released
- General improvements:
- numerous bugfixes and performance improvements
- simulation can now be locked to real time
- simpler and more complete support for dynamic parameters
- updated to Python 2.5 and numpy 1.1.1.
- source code moved from CVS to Subversion (SVN)
- automatic Windows and Mac daily builds
- automatic running and startup performance measurement
- contrib dir
- divisive and multiplicative connections
- simulation time is now a rational number for precision
- PyTables HDF5 interface
- more options for adding noise
- Command-line and batch:
- simplified example file syntax (see examples/lissom_oo_or.ty and som_retinotopy.py)
- command prompt uses IPython for better debugging, help
- simulation name set automatically from .ty script name by default
- command-line options can be called explicitly
- GUI:
- model editor fully supports dynamic parameters (described in the lissom_oo_or tutorial)
- plot windows can be docked into main window
- uses tk8.5 for anti-aliased fonts
- Plotting:
- new preference map types (Hue, Direction, Speed)
- combined (joint) plots using contour and arrow overlays
- example of generating activity movies (examples/lissom_or_movie.ty)
- Example scripts:
- example files for robotics interfacing (misc/playerrobot.py, misc/robotics.py)
- simulation, plots, and analysis for modelling of any combination of position, orientation, ocular dominance, stereoscopic disparity, motion direction, speed, spatial frequency, and color (examples/lissom.ty).
- Component library:
- OutputFns: PoissonSample, ScalingOF (for homeostatic plasticity), NakaRushton (for contrast gain control) AttributeTrackingOF (for analyzing or plotting values over time)
- PatternGenerator: CameraImage (for real-time camera inputs)
- CoordMapper: Jitter
- SheetMasks: AndMask, OrMask, CompositeSheetMask
- command: decode_feature (for estimating perceived values) (e.g. for calculating aftereffects)
- functions for analyzing V1 complex cells
- PipelineOF OutputFns can now be constructed easily using +
- NumberGenerators can now be constructed using +,-,/,*,abs etc.
We also provide a utility to update scripts that were written for version 0.9.4.
26 October 2007: Version 0.9.4 released
- General improvements:
- numerous bugfixes
- set up automatic daily builds
- Example scripts:
- new whisker barrel cortex simulation (using transparent Matlab wrapper)
- new elastic net ocular dominance simulation
- new spiking example; still needs generalizing
- Command-line and batch:
- batch mode for running multiple similar simulations
- saving bitmaps from script/command-line (for batch runs)
- script/command-line control over GUI
- added auto-import option (-a and -g) to save typing
- GUI:
- greatly simplified adding GUI code
- added progress bars, scroll bars, window icons
- new Step button on console
- Plotting:
- reverse-correlation RF mapping
- 3D wireframe plotting (in right-click menu)
- gradient plots, histogram plots (in right-click menu)
- simplified bitmap plotting (removed template classes)
- GUI plots can be saved as PNG or EPS (right-click menu)
- automatic collection of plots for animations (see ./topographica examples/lissom_or_movie.ty)
- Component library:
- new coordmappers (Grid, Pipeline, Polar/Cartesian)
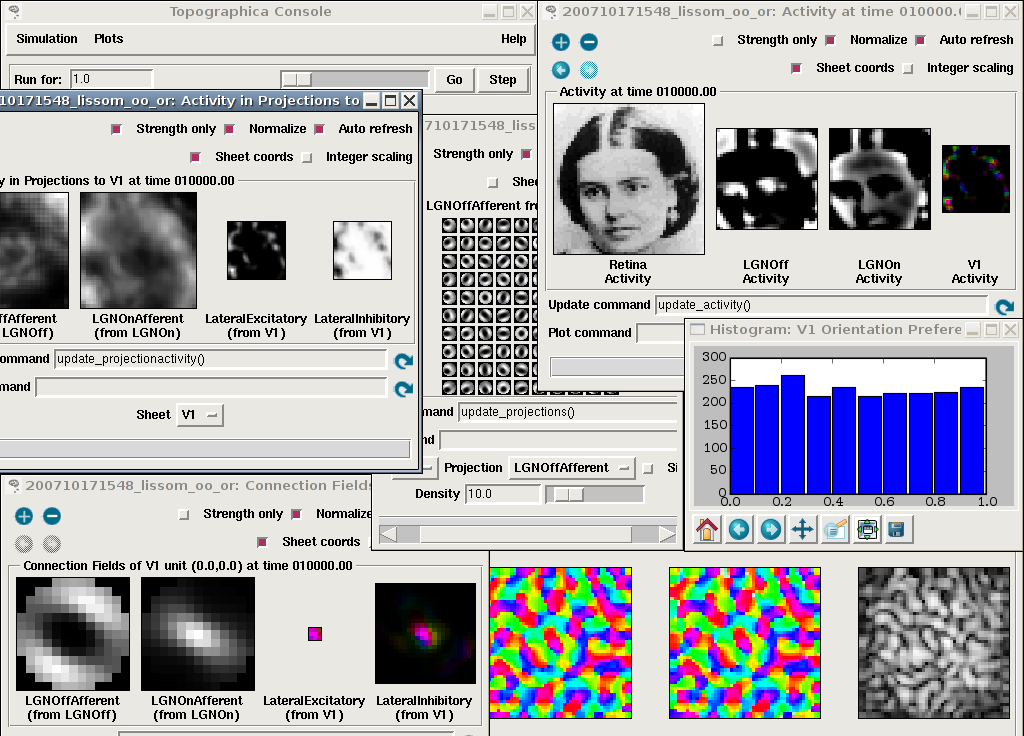
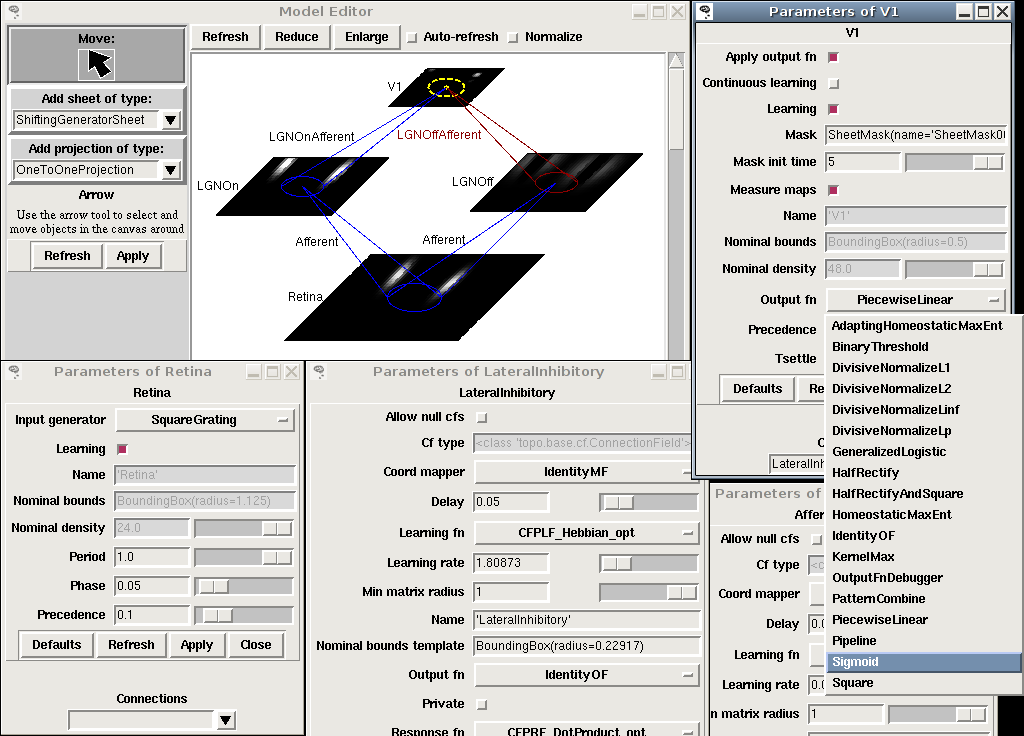
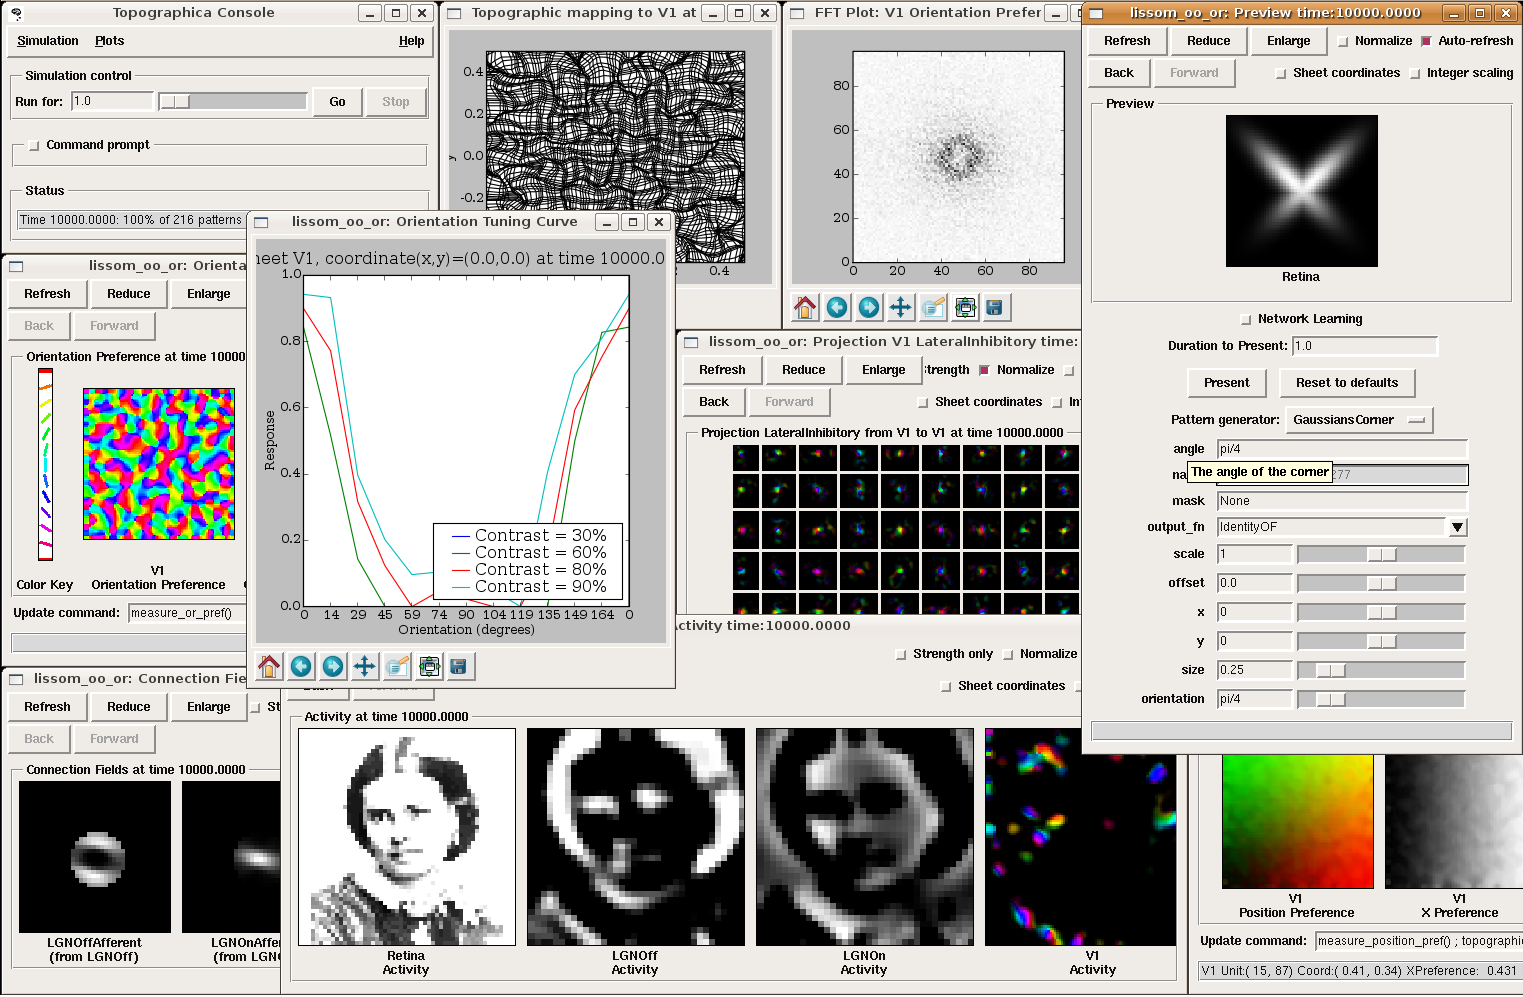
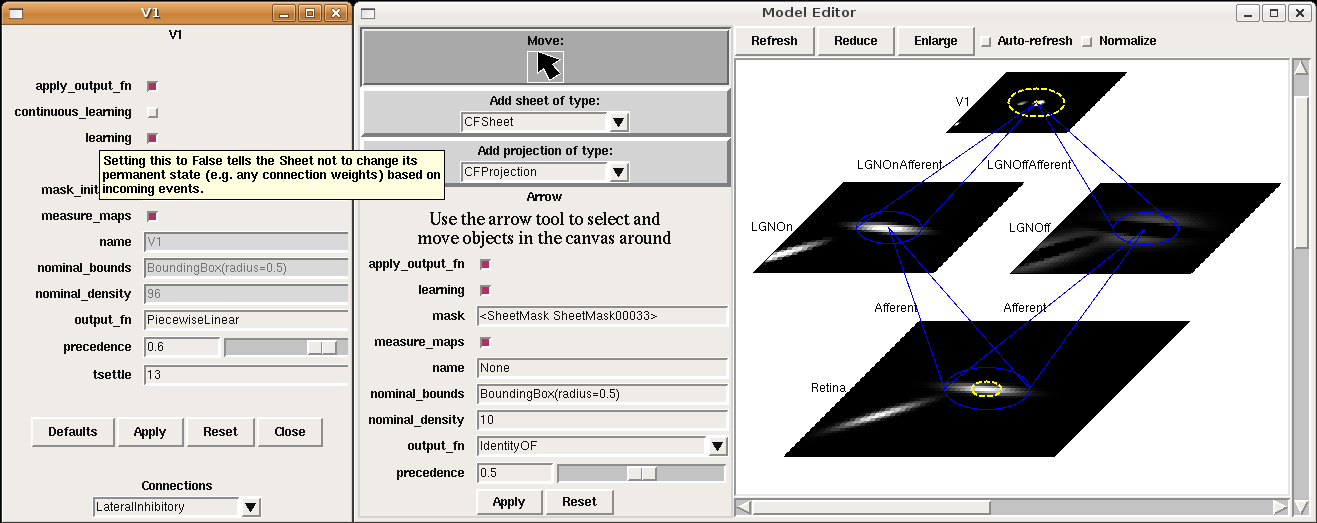
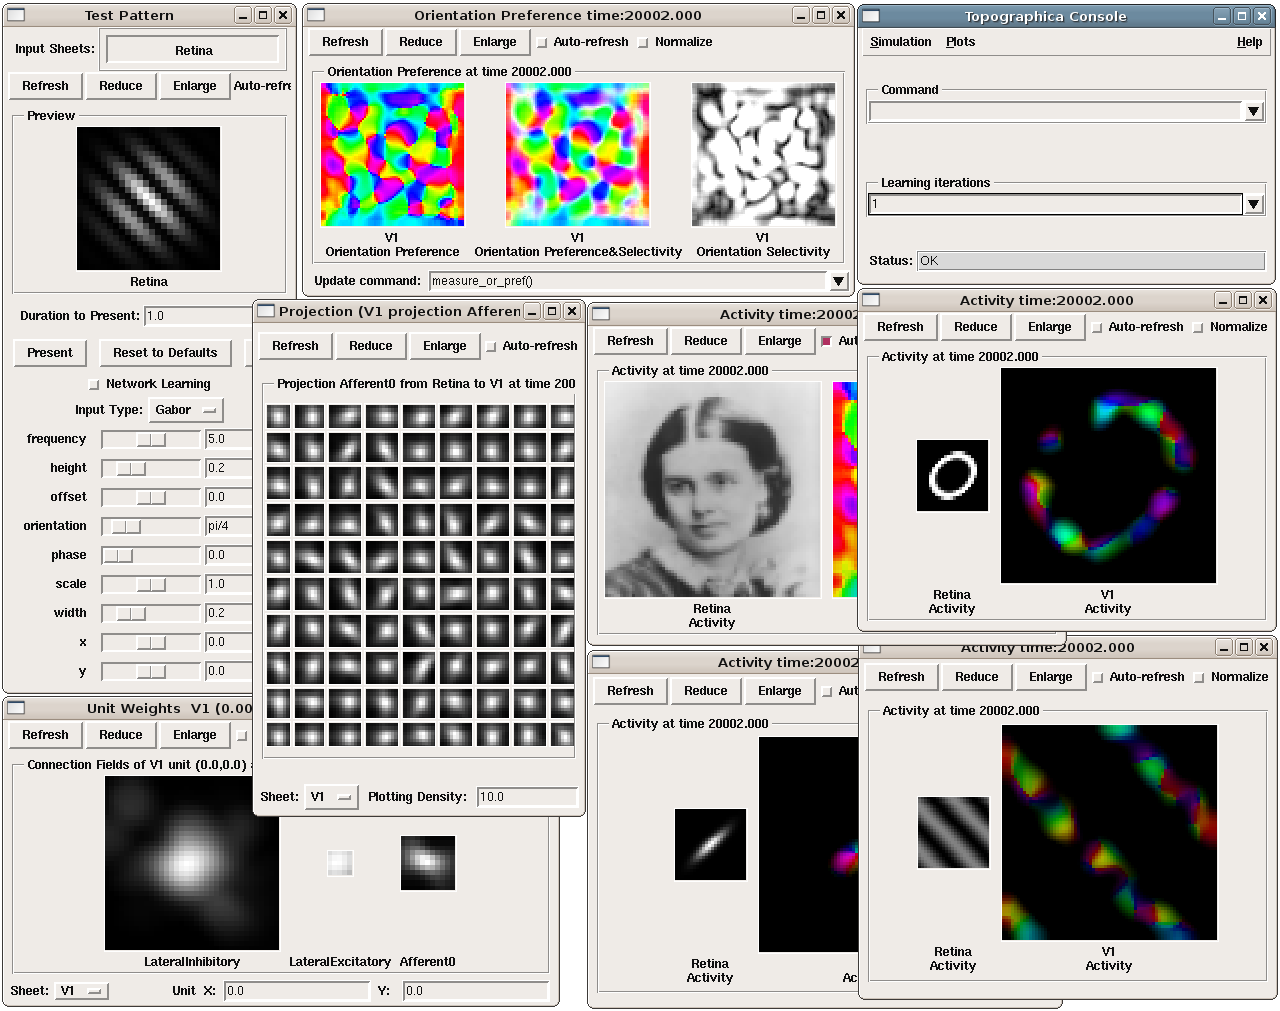
Screenshots: plotting 1, plotting 2, updated model editor screenshot.
23 April 2007: Version 0.9.3 released
- General improvements:
- numerous bugfixes
- significant optimizations (~5 times faster)
- compressed snapshots (1/3 as large)
- much-improved reference manual
- Component library:
- adding noise to any calculation
- lesioning units and non-rectangular sheet shapes (see PatternCombine)
- basic auditory pattern generation
- greatly simplified SOM support
- more dynamic parameters (such as ExponentialDecay)
- flexible mapping of ConnectionField centers between sheets
- Example scripts:
- examples that more closely match published simulations
- new simulations for face processing and for self-organization from natural images
- GUI:
- Better OS X and Windows support
- progress reporting for map measurement
- dynamic display of coordinates in plots
- stop button to interrupt training safely
- ability to plot and analyze during training
- right-click menu for analysis of bitmap plots
- saving current simulation as an editable .ty script
- Command-line and batch:
- site-specific commands in ~/.topographicarc
- simple functions for doing optimization
- Plotting:
- spatial frequency map plots
- tuning curve plots
- FFT transforms (in right-click menu)
Screenshots: Plotting, Model editor screenshot.
29 November 2006: Topographica talk at PyCon
There will be a short talk on Topographica at the PyCon 2007 convention, February 23-25, 2007.
22 November 2006: Version 0.9.2 released
Includes numerous bugfixes (e.g. to support GCC 4.1.x compilers), much more complete user manual, more useful reference manual, more sample models, flexible joint normalization across Projections, arbitrary control of mapping CF centers (see CoordinateMapperFn), Composite and Selector patterns to allow flexible combinations of input patterns, homeostatic learning and output functions, sigmoid and generalized logistic output functions, and a new disparity map example (including a random dot stereogram input pattern).
02 November 2006: GCC 4.1.x problems reported
Some users have reported problems when using optimized code on systems with the most recent GCC 4.1.x C/C++ compilers. We have added a patch to the included weave inline-compilation package that should fix the problem, currently available only on the most recent CVS version of Topographica. Affected users may need to do a CVS update, then “make -C external weave-uninstall ; make”. These changes will be included in the next official release.
23 July 2006: Version 0.9.1 released
This is a bugfix release only, upgrading the included Tcl/Tk package to correct a syntax error in its configure script, which had been preventing compilation on platforms using bash 3.1 (such as Ubuntu 6.06). There is no benefit to updating if 0.9.0 already runs on your platform.
07 June 2006: Version 0.9.0 released
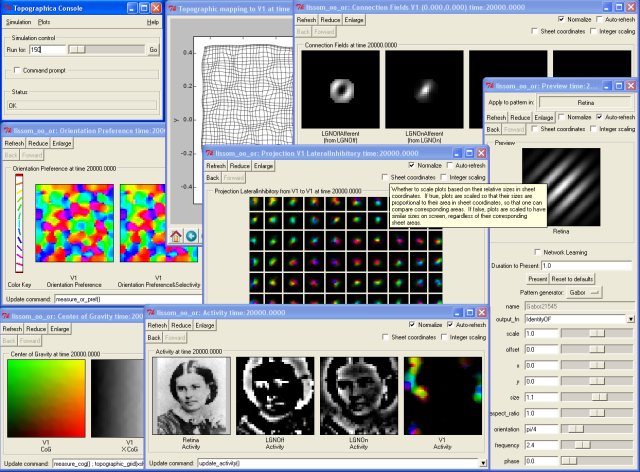
Includes numerous bugfixes, context-sensitive (balloon) help for nearly every parameter and control, full Windows support (screenshot), full Mac OS X support, downloadable installation files, significant performance increases (7X faster on the main example scripts, with more speedups to come), faster startup, better memory management, simpler programming interface, improved state saving (e.g. no longer requiring the original script), independently controllable random number streams, plot window histories, more library components (e.g. Oja rule, CPCA, covariance), prototype spiking neuron support, and much-improved model editor.
15 May 2006: New book Computational Maps in the Visual Cortex available
Includes background on modeling computational maps, a review of visual cortex models, and an extended set of examples of the types of models supported by Topographica.
20 February 2006: Version 0.8.2 released
Includes numerous bugfixes, circular receptive fields, shared-weight projections, tutorial with ON/OFF LGN model, SOM retinotopy tutorial, Euclidean-distance-based response and learning functions, density-independent SOM parameters, Mac OS X instructions, developer manual, partial user manual, much-improved model editor (screenshot), generic Matlab-style plotting, topographic grid plotting, RGB plots, user-controllable plot sorting, plot color keys, and progress reports during learning. See the Linux screenshot.
22 December 2005: Version 0.8.1 released
Includes numerous bugfixes, more flexible plotting (including weight colorization), user-controllable optimization, properties panels, more-useful reference manual, image input patterns, and a prototype graphical model editor.
8 November 2005: New site launched with Topographica version 0.8.0
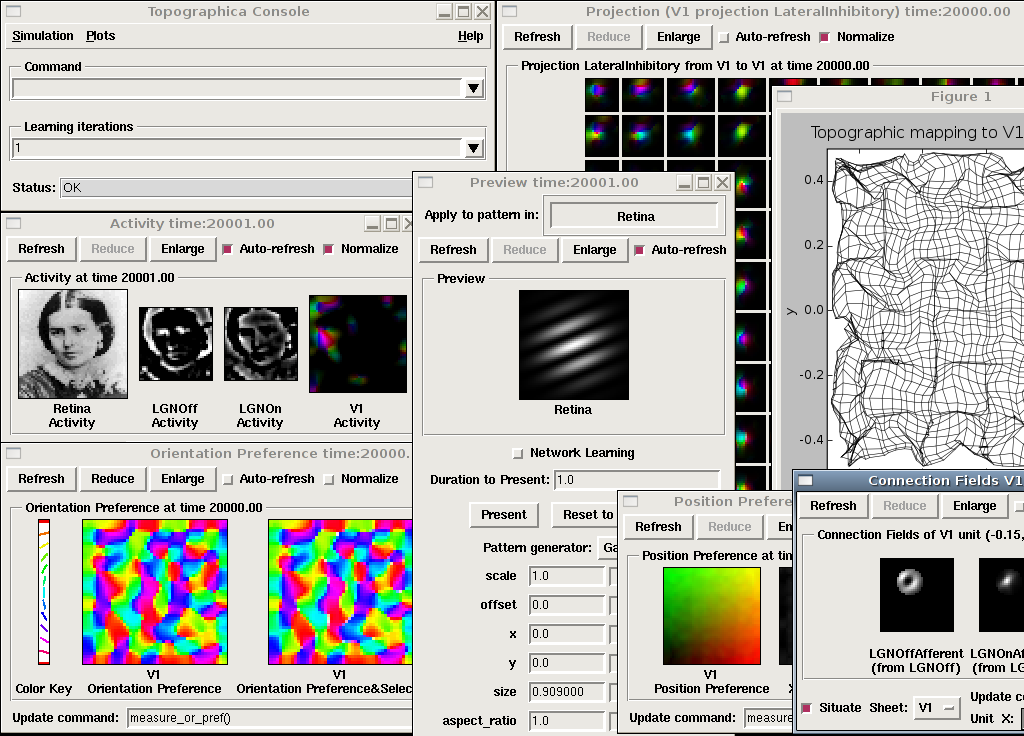
Includes a new LISSOM tutorial. (Linux screenshot).

- Home
- News
- Downloads
- Tutorials
- User Manual
- Reference Manual
- Developer Manual
- Github Source Code
- Forums
- Team Members
- Future Work
- FAQ
- Links
- Publications
- Site Map
Table Of Contents
- News
- 4 Nov 2013: Reproducible paper with Lancet and IPython Notebook
- 2 Oct 2013: New paper using Topographica
- 2 May 2013: New web site
- 23 Nov 2012: Version 0.9.8 released
- 3 Oct 2012: Topographica development moved from SourceForge SVN to GitHub git.
- 18 Jul 2012: New subprojects at GitHub
- 18 July 2010: Version 0.9.7 released
- 12 February 2009: Version 0.9.6 released
- 05 September 2008: Version 0.9.5 released
- 26 October 2007: Version 0.9.4 released
- 23 April 2007: Version 0.9.3 released
- 29 November 2006: Topographica talk at PyCon
- 22 November 2006: Version 0.9.2 released
- 02 November 2006: GCC 4.1.x problems reported
- 23 July 2006: Version 0.9.1 released
- 07 June 2006: Version 0.9.0 released
- 15 May 2006: New book Computational Maps in the Visual Cortex available
- 20 February 2006: Version 0.8.2 released
- 22 December 2005: Version 0.8.1 released
- 8 November 2005: New site launched with Topographica version 0.8.0